
Key Performance Indicators For Your Business
Bear in mind that some of the links in this post are affiliate links and we may earn money or products from the companies mentioned in this post. You won't pay any additional costs. The decision is yours, and whether or not you decide to buy something is completely up to you..
If you don’t have a Key Performance Indicator (KPI) strategy or system in place today you are operating your business at risk. Or at least with a limited view of your business as it relates to your goals. If you haven’t yet developed Key Performance Indicators For Your Business keep reading to learn why, what, and how to accomplish this business critical component.
So what exactly is a Key Performance Indicator or KPI for short?
A Key Performance Indicator is a metric that reports how effective a company is at achieving key sales, operations, marketing, and business goals. When you begin defining the Key Performance Indicators For Your Business you need to keep in mind these are key metrics or measures. Remember, just because you can measure something doesn’t mean you should…it could be a waste of time.
Myth – Small businesses don’t need key performance indicators…Wrong
Small business’ can see the same benefits are larger organizations with a proper KPI strategy, In some cases it is even more critical for small business’ to have foresight into a potential issues because they don’t always have large cash reserves should an issue arise.
No matter what size business you operate having key performance indicators for your business allow you to have monitoring and targets identified on a global and individual scale. In addition, having defined key performance indicators allows you to measure your business activities consistently. Not only that but everybody in your business will measure objectives the same way,
Key performance indicators should be aligned to top-level strategies. Not only does this allow you to measure progress but it also give you an avenue to communicate your company goals to the organization. This is huge as we know effective communications within business is extremely critical and very difficult to do consistently.
Proper key performance indicators for your business allows you to direct behaviors within your company. You are defining the measurements which are important to the success and growth of your company, so team members will work toward these objective. In addition KPIs also serve as a platform for performance evaluation.
So how can you tell which key performance indicators for your business are valuable or a waste of time and money?
If you don’t take anything else from this article, then at least walk away with this…ask yourself will I ever use this data or key performance indicator to make a “business decision” or am I just capturing & measuring it because I can. This is an extremely important concept, so let’s dive into this concept.
When you define key performance indicators for your business they absolutely can’t be arbitrary, numerous, and time consuming to measure. If your team members spend as much time recording or “massaging” data to achieve their key performance indicators for your business you have missed the mark. Key performance indicators shouldn’t be excessive effort, if they are you’re reducing productivity to measure productivity…that doesn’t sound right.
First, stick to the high level objectives of your business, departments, and individuals. Key performance indicators for your business should be defined in a way so they tell you a story. You should be able to look at these measures and get a relatively instant picture of the performance of the business, department, or individual. Now the specific measures of your business will vary based on your industry, but the methodology used to develop the strategy should be very similar.
I can’t stress it enough that your key performance indicators need to instantly show you how your business is performing. If your KPIs don’t do this then you heaven’t defined them properly. These are not just metrics or measures they are “Key” performance indicators.
So how do we get started?
Before we walk through a specific examples of key performance indicators for your business, let’s define what makes an effective KPI.
- Simple – KPIs should be simple enough so team members can understand exactly what is being measured and how it relates to the overall company goals.
- Measurable – KPIs must measurable for team members to analyze their performance. A KPIs doesn’t have to be quantitative to be measurable.
- Actionable – An effective KPI must prompt a decision by a team member or department. When they understand what exactly efforts reflect within a KPI they are extremely effective.
- Timely – The resulting KPIs must be provided at the appropriate frequency and in a complete state. If the KPI is incomplete or questionable, then the adoption rate of your KPI will lag.
- Visible – Making KPIs visible across the organization communicates to team members and departments how they are impacting the overall goals of the company.
- Aligned – KPIs should fall under the umbrella of the goals and objectives of the company and them must not conflict each other. In addition, when KPIs are communicated throughout an organization you will drive alignment in terms of everyone talking about the same data and calculations. It absolutely drive me crazy when different departments measure metrics differently.
Now let’s jump into some real-world key performance indicators for your business

Gross Profit Margin:
| (Revenue – COGS) / Revenue |
This goes without saying…this is one of the most important key performance indicators for your business. Gross Profit Margin is the percentage of revenue before adjusting for by subtracting COGS (Cost of Goods Sold). Gross profit margin indicates what percentage of each dollar in sales you get to keep after paying the expenses related to making the product.
Gross profit margin is an great key performance indicators for your business because it keeps focus on growing profits, not just revenue. When you are going through you budgeting process you are generally setting a gross profit margin percentage to achieve at fiscal year end. This is the metric to measure how you are performing toward this business critical key performance indicator.
Net Profit Margin:
| Net Profit / Total Revenue) |
Net profit margin is the amount of dollars you have remaining after subtracting expenses from your revenue. You need to pay attention to both of these key performance indicators to allow you to gauge the health & profitability of your business.
Note – Gross profit margin takes into accounts direct costs while net profit margin accounts for the “other” costs.
Budget Variance:
| (Forecast – Actual ) / Actual |
The budget variance is a key performance indicator to measure how well you actual expense or revenue forecast performs against the actual spending. The budget variance is favorable when the actual spending is less than the forecast amount over the time period. Unfavorable budget variance are usually caused by lack of detail and effort during the forecasting process.
Inventory Turnover Ratio:
| (Beginning Inventory – Ending Inventory) / 2 |
If you carry inventory the this is an important key performance indicator for your business. The inventory turnover key performance indicator is an efficiency ratio which indicates how effectively inventory is managed by comparing COGS with average inventory over a period of time. This key performance indicator balances stocking levels with holding costs.
On Time Shipments:
| (Request Date – Shipment Date |
This one is fairly straight forward, if you are accurately tracking customer requested shipment dates and actual shipment-in-full dates. This key performance indicator is a data point to measuring customer satisfaction.
If you aren’t tracking them numbers you need to begin and don’t worry it doesn’t have to complicated. You can simply begin using Excel to track customer orders and shipment dates so you can measure this via your key performance indicator solution.
Labor & Material Variances:
| (Standard Cost or Qty – Actual Costs or Qty) |
I don’t want to get into a deep discussion about costing methodologies, so lets take a look from a standard cost model. If you’re not familiar with this concept then check out the Standard Costing Overview
Labor variance occurs when you actual expenses linked to a labor activity varies based on the preset amount “Standard Cost” . The variations could be favorable or unfavorable resulting in the variance. This is an importance key performance indicator for your business if your operations include manufacturing process with large investment in labor.
This is a data point to measuring productivity on your production floor. We need to be evaluating if we are manufacturing at the rates we defined in the budgeting process. If we are trending toward an unfavorable labor variances we are at risk of unfavorable budget variance as well.
Material variances are similar in how they are measured; standard vs actual. When we look at building standard materials for a good unit, this should include materials required based on production, scrap factors, and yield of a particular operation. In order to build a realistic standard all of these factors need to be considered.
While you can look at this on a global scale, it can also be segmented into small scopes such as product lines, products, market, etc. Also these particular variance can be evaluated based on quantity and dollars.
Quality Escapes:
| RMAs + Customer Complains(Quality) |
Another data point for measuring customer satisfaction is quality escapes. When a customer order item is shipped is the product returned via an RMA or is there a customer complaint concerning the quality of the product.
This particular key performance indicator measures the escapes, so this also identifies failures in your internal quality process which have allowed the escape.
Can key performance indicators be extended to other areas of your business?
Absolutely!
Website Conversions:
| (Opt-Ins / Visitors) * 100 |
Your website is one of you most valuable marketing tools. Tracking visitors who sign-up for your mailing list is a valuable key performance indicator for your business. If someone is signing up for mailing list, free giveaway, etc. they are a lead and a potential customer. If you’re not measuring this KPI, you need to start managing your sales funnel and optimizing it to increase conversions.
Even if you have a brick and motor store the first place a potential lead or customer will look is online to research your services or products.
Productivity:
| (Benchmark / Input) |
Business’ strive to be productive, not busy. Busy indicates accomplishing very little to show for your efforts. Trending productivity can be implemented into any department or individual.
Let’s say you have a sales team of 4 and they generated revenue $400,000. Now some will say to take (revenue / sales team), I really don’t like that method because this makes the assumption each team member generates an equal share of the revenue and we know that’s not going to be the case.
I rather set this KPI goal at a department and individual level(s). This way you can say your revenue goal is going to be $400,000 and each individual has a KPI goal of $100,000. Now trend this year over year to measure their productivity.
Key Performance Indicator Solution
There isn’t a shortage of product or solutions on the market to track your key performance indicators. As you develop a KPI strategy you’ll need to evaluate these products so you can make the best choice for your needs. The product I’m going to use for reference in this article is Power BI.
Power BI is an excellent tool which offers free and paid options. It also offers in-depth Business Intelligence and KPI functionality. If you want to see the difference between the free and paid very check-out the comparison.
Power BI Features
-
- Seamless integration to 60+ applications
- Very low learning curve
- Drag & drop functionality
- Ability to drill through to the data driving the metric
- Scheduled refreshes for your data
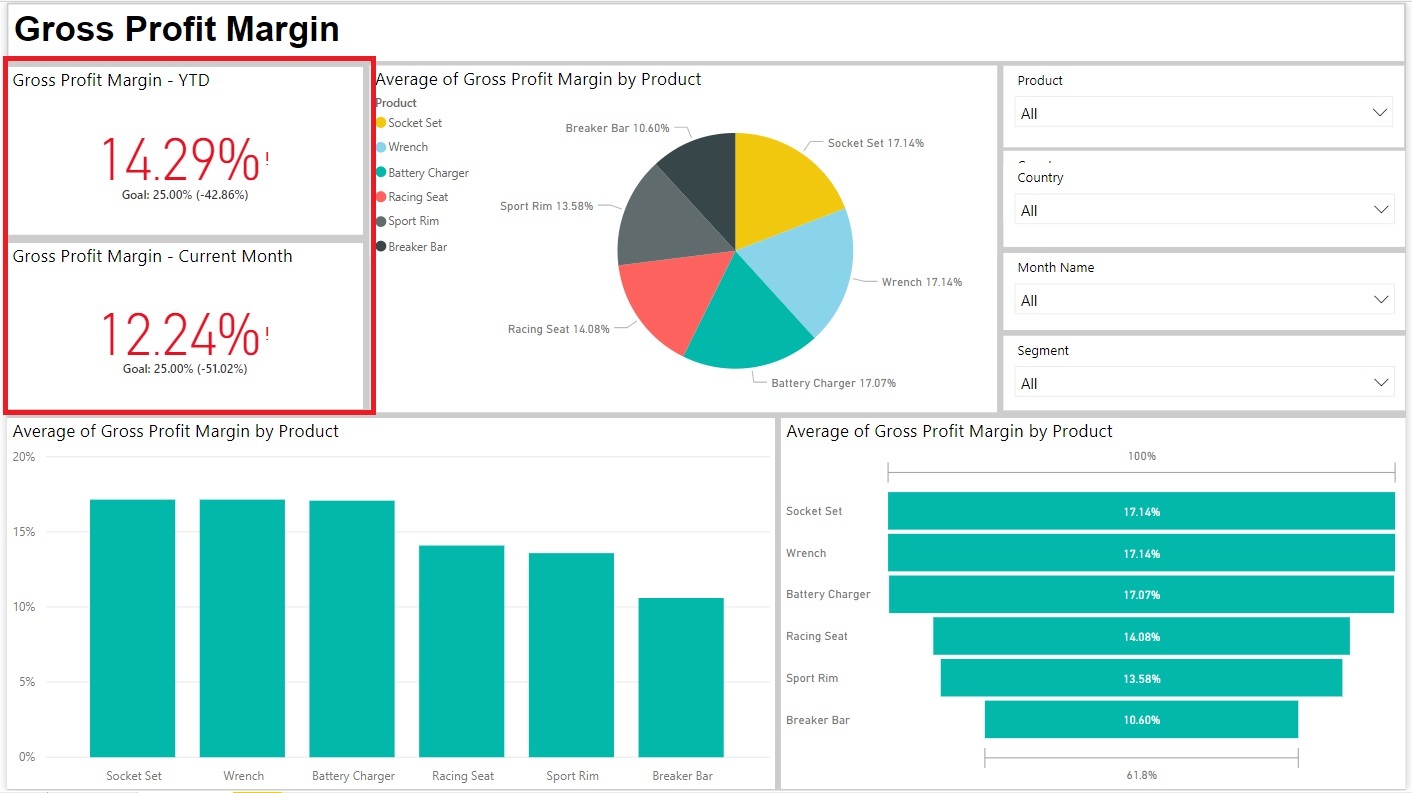
Power BI give you many standard visuals to create unique dashboards, reports, and KPI’s to meet your business needs. Below are a a few mock-ups I put together in about 15 minutes. Imagine what this tool could unlock for you as part of a data driven strategy.
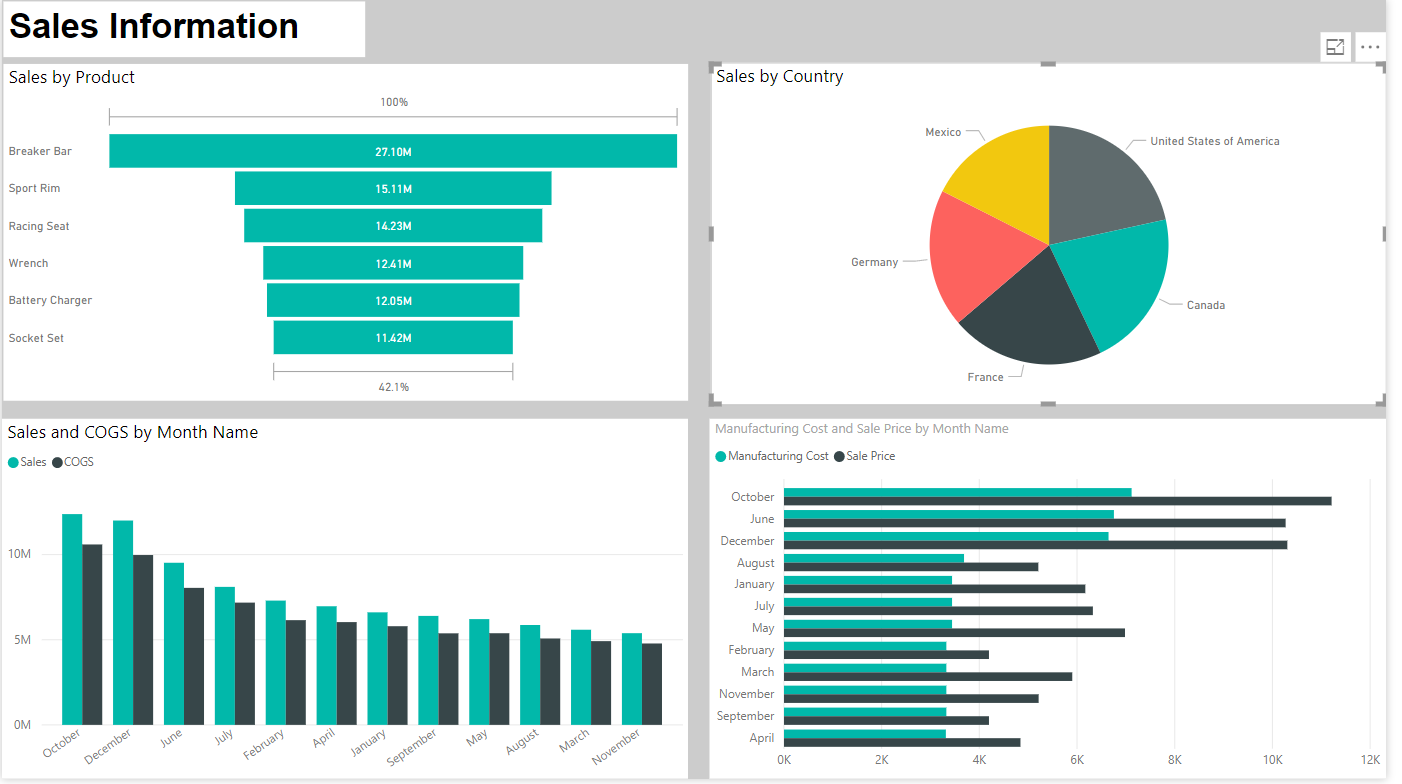
As you can see in the image below the key performance indicator visuals allow you to track actual performance vs. company goals or objectives
Conclusion
Every business person should strive to create pinpoint KPIs as part of their data driven strategy. This strategy can propel a successful business to even greater profits and success. Struggling companies can benefit from a data driven strategy to identify areas of concern and risk. Business decisions are made every day and one of the greatest risks to a business is these decisions are made without analyzing all the data to make the best decision.
If you have any questions or concerns we’re always here to help.

To your success!