
Syteline Forecasting
Table of Contents
Bear in mind that some of the links in this post are affiliate links and we may earn money or products from the companies mentioned in this post. You won't pay any additional costs. The decision is yours, and whether or not you decide to buy something is completely up to you..
If you haven’t started using the Syteline Forecasting Module, you are missing a significant feature in your planning toolbox.If a formal Syteline Forecasting process hasn’t been implemented, your business is increasing the potential risk of excessive costs and lost profitability.
For manufacturers, many factors contribute to an healthy, efficient, and productive operation. One important factor that can get overlooked is forecasting. Projecting your sales targets for the year is critical to achieve revenue goals and subsequently allow for material and labor needs.
Are you carrying the right amount of inventory?
If not, you might be burning excessive costs on expediting fees and carrying costs.
If your forecasting process involves manual spreadsheets, formulas, pivot tables, and guessing you’ll want to keep reading to learn how Syteline Forecasting and some best-practices can benefit your process.
As a bonus, we’ll provide information how to leverage Power BI to fast-track your forecasting analysis.
Let’s get started…
No matter your manufacturing process, you can turn inventory management into a competitive advantage with Infor Syteline Forecasting.
Here is the Syteline Forecasting Form, now let’s break it down…
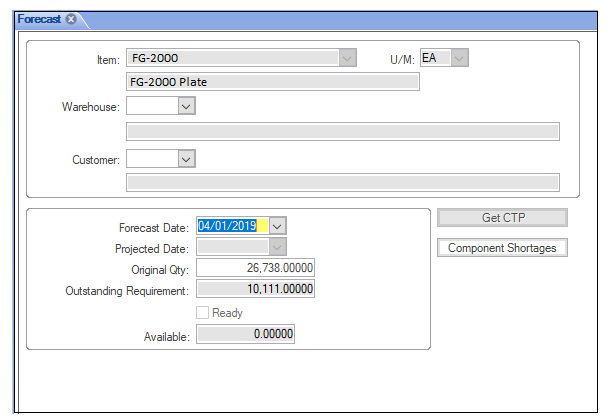
Syteline Forecasting Field Breakdown
Item – The item you want to forecast
Warehouse – You can enter a Warehouse, if you want to forecast an item in a specific warehouse
Customer – You can enter a customer number, if you want to forecast an item in for a specific customer
Forecast Date – This is the date you plan for the forecast to be consumed
Original Qty – The original quantity of the forecast to be consumed by the forecast date
Outstanding Requirement – The remaining quantity to be consumed by at the given point in time. This is the net-quantity which will identified as “PLNs” in your plan
There are a few other parameters we need to mention, since they impact how Syteline Forecasting functions.
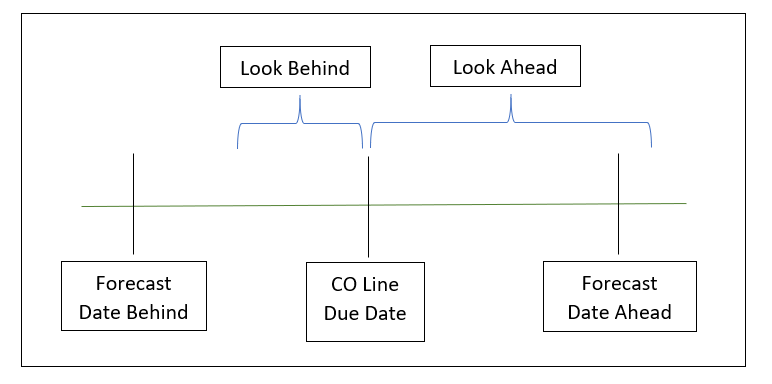
Forecast Look Ahead & Look Behind
These parameters exist at a global Planning Parameters level or at the Item Product Code level. These parameters allow you to determine the days ahead or behind the customer order line due date to see which forecast to consume. This is based on the Forecast Date defined on the Forecast Form.
- Forecast Look Ahead/Behind – When a Customer Order is entered, the planning system starts at the Customer Order item due date. The Planning system processing will look Behind the specified number of valid manufacturing days to find a forecast to consume. If a forecast isn’t found the planning system will look the specified number of valid manufacturing Ahead.
***Note: If you need to configure Forecast Ahead/Behind on a more granular level this can be done on the Product Codes Form. This will override the Planning Parameters values.
Syteline Forecasting Landscape
As you can see the Syteline Forecasting Module gives you the flexibility to consume current or past forecasts. Additionally these forecasting amounts integrate within the APS & MRP systems, to drive forecast plans. While the native functionality of the Syteline Forecasting module isn’t very extensive in terms of forecast analysis, it has enough functionality to manage and adjust to forecast performance.
Think of the Syteline Forecasting Module as a place to enter your final forecasts. The downside to the Syteline Forecasting module is there isn’t extensive functionality to analyze and derive your forecast information. But not to worry we’ll show you how this can be accomplished with Power BI.
If you’re not familiar this is a free analytics tool you can use to build models to support business processes. And the nice part is you can connect to a SQL Server and Cloud-Based services for integration purposes.
If you want comprehensive information on MRP configuration & supporting concepts, check out our Syteline Material Requirements Planning Article
PowerBI and your Syteline Forecasting
Most likely your sales, inventory, and supporting data already exists in Syteline or other supporting systems. So this means you have all the data to build any type of forecast & performance analytics and reporting you need to analyze . Now you just need a way to build the analysis for your business to produce your forecast numbers.
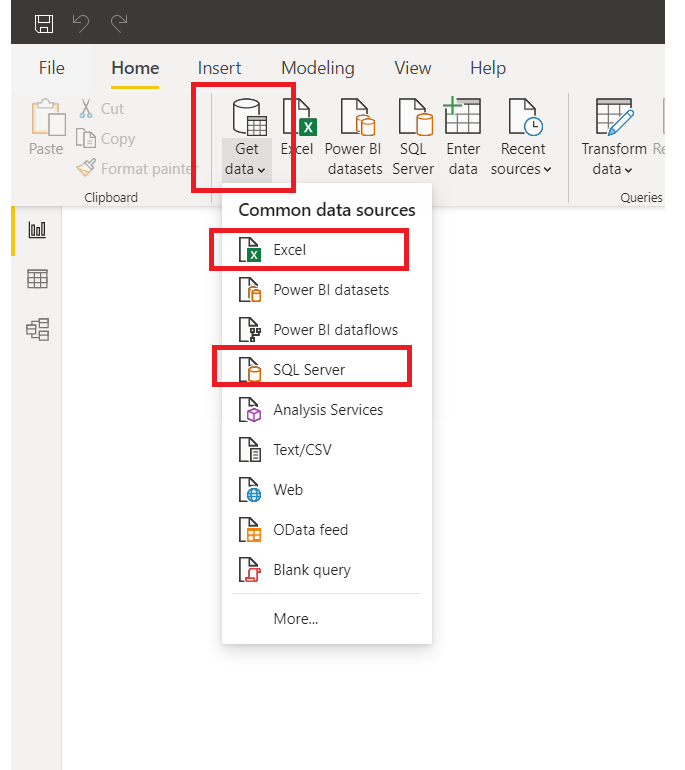
Within PowerBI you can add connection to many data sources, two in particular are Excel and SQL Server.
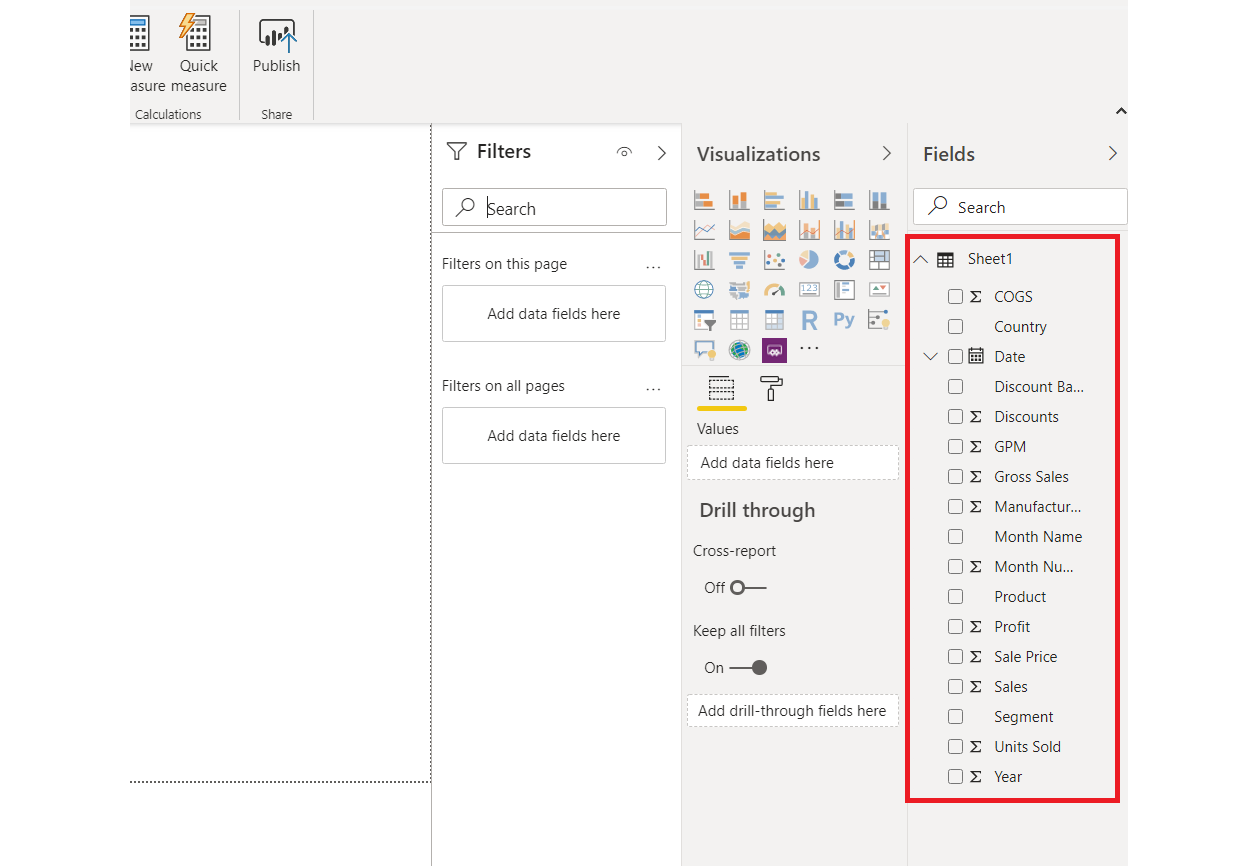
Using Excel as example, let’s say you imported your data such as: Segment, Country, Product, Units Sold, Manufacturing CostS, Sale Price, Gross Sales, COGS, Profit, & GPM into PowerBI. You now have ability to leverage the PowerBI toolset for analysis.
After connecting your PowerBI model to an Excel source you’ll be able to see all data within PowerBI.
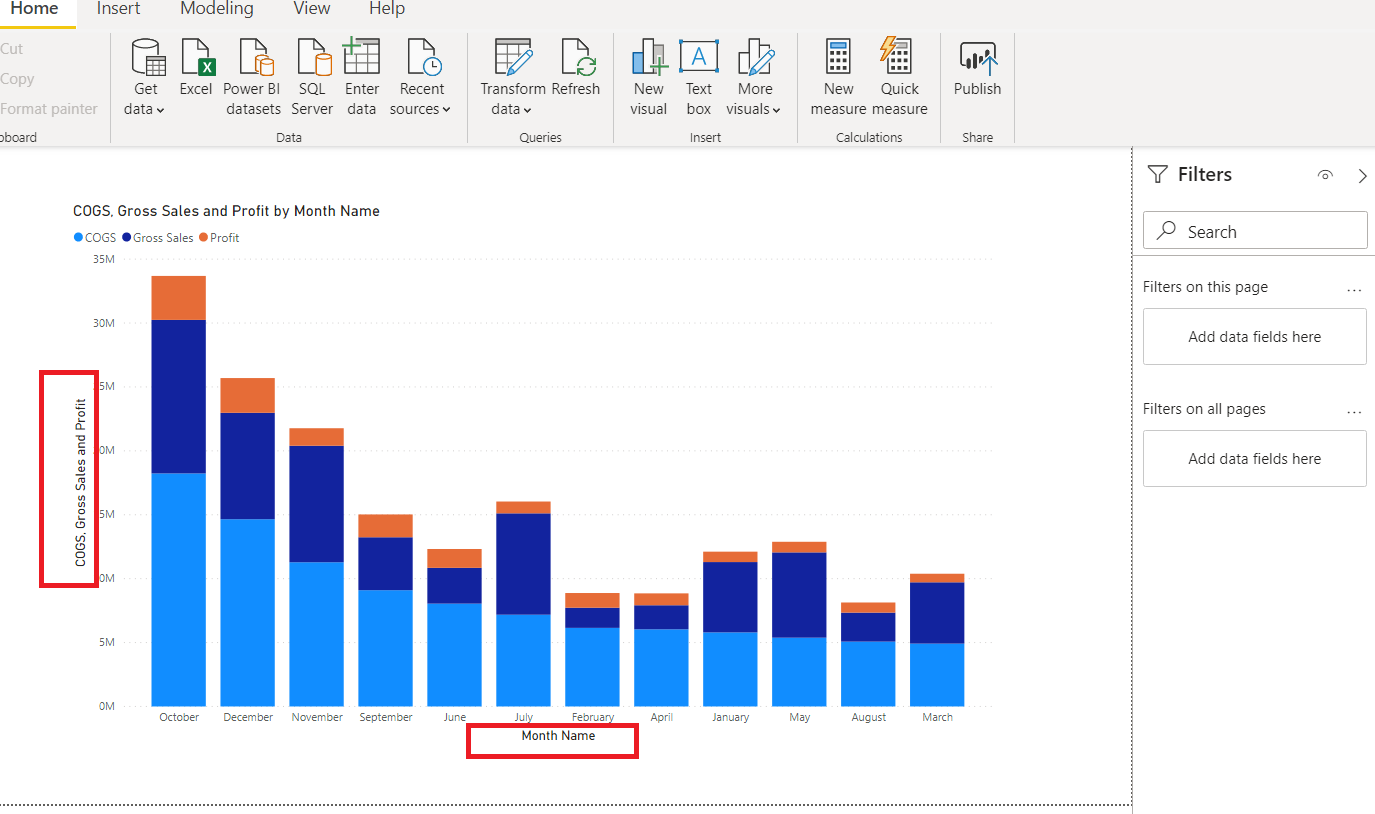
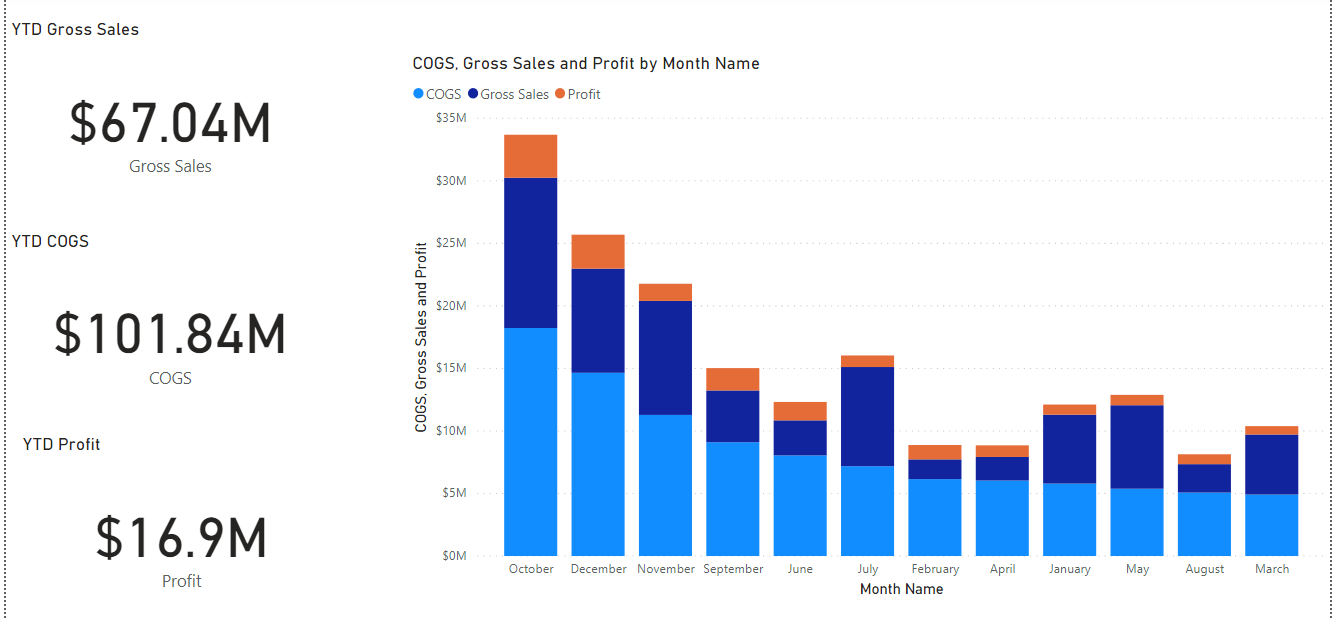
With PowerBI, you’ll be able to create graphs and visuals of all levels for analysis. In the below example I added COGS, Gross Sales, and Profit by Month.
Or you can add summary cards as additional visuals.
Really this is just the tip of the iceberg as far as the value and benefit of using PowerBI to enhance your Syteline Forecasting. Aside from the apparent benefits, also consider…
- Minimal upfront costs for PowerBI
- Consolidate multiple data sources into a model
- Drag & drop functionality, with the ability to create custom calculation with DAX
- Schedule refreshes
- Drilldown ability into data results
Forecast Strategies
There are countless methodologies when it comes to forecasting and demand management. Each have their pros & cons, so I’m going to cover some of the best practices. Hopefully you can use this information to expand or begin to implement a forecasting process in your business.
Forecasting Accuracy
There are many standards companies use to determine the forecast accuracy and/or error. Some commonly used metrics include:
Mean Absolute Deviation (MAD) = ABS (Actual – Forecast)
Mean Absolute Percent Error (MAPE) = 100 * (ABS (Actual – Forecast)/Actual)
All these metrics work great at various levels, but a word of caution…

You really need to be evaluating forecast accuracy at the lowest segment possible, for instance perhaps at a SKU level. If not, negative and positive errors will offset each other. Resulting in a forecast accuracy which reports better than the reality.
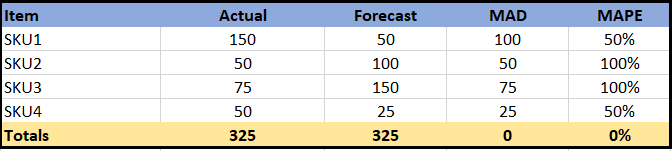
In the example above the MAD and MAPE are calculated at the global level with a zero error. In reality this isn’t the truth. When we look at the SKU level we are seeing significant variation in the forecast accuracy,
As you evaluate forecast and inventory performance, you need to make sure you are determining which which elements or SKUs are your top and low performers. This will allow you to make the best decisions for your business.
Why all the effort to develop a forecast?
-
Cost Reduction
Sure you can store inventory in a warehouse, but when the inventory exceeds you needs you are wasting time and money. Why invest dollars to maintain inventory which isn’t going to be turned efficiently. Remember the cost of carrying the inventory isn’t only the purchase cost, but the added expenses of carrying the inventory,
-
More efficient and production operations
Managing your supply chain can have a positive impact to your operations.When you know the lead times, forecasts, safety stock levels, etc. you can increase you velocity and decrease your costs. This shouldn’t be a guessing game, when you understand lead times, forecasts, safety stocks, lot sizes, manufacturing velocity, etc. you can make informed decisions for your business.
-
Increased Profitability
If you look at one of your product lines or items and you could reduce your investment in inventory. How would this affect your profitability? Could you do something valuable with the free capital? With less inventory could your headcount be reduced?
Wrap Up
Forecasting is the critical business process around which strategic and operational plans of a company are based. Forecasting is an important factor in the budgeting, sales planning, manufacturing requirements, and labor needs.
By committing to a forecasting process, you’ll be in a position to to improve your business.
To your success!!